Twenty-five dollars at a time
Katie Wilson raised most of her mayoral campaign in $25 city vouchers, faced an opposition fund larger than her entire budget, and became mayor of Seattle by 2,011 votes.
Two campaigns, two currencies
Seattle mails every resident four $25 Democracy Vouchers in a city election year. In 2025, for the first time, the program funded the winning side of a mayor’s race against the full weight of conventional money.
Katie Wilson’s committee raised $1,024,960. Of that, $795,925 — 77.7% — arrived as vouchers, redeemed by 12,622 residents. Named, itemized donors gave her just $210,000, and only 110 of them reached the $650 contribution cap.
Bruce Harrell’s committee raised $1,189,662 — 41% vouchers, 59% named donors, with four times as many maxed-out contributors. Both campaigns spent essentially every dollar.
The two donor pools did not touch. Not one named donor in the state disclosure records gave to both campaigns. Wilson’s named money was 87% Seattle; Harrell drew six times as much from outside the city, and the fund that spent against Wilson drew heavily on Bellevue, Medina and Mercer Island.
| Committee | Raised | Vouchers | Voucher share | Named donors | Donors at $650 cap | Spent |
|---|---|---|---|---|---|---|
| Katie Wilson | $1,024,960 | $795,925 | 77.7% | $209,659 | 110 | $1,028,723 |
| Bruce Harrell | $1,189,662 | $487,075 | 40.9% | $698,467 | 434 | $1,193,148 |
| Ry Armstrong | $388,214 | $342,725 | 88.3% | — | — | $364,666 |
| Joe Mallahan | $165,527 | — | — | — | — | $161,804 |
The million dollars that arrived in October
The bigger money in this race never touched either campaign. Independent-expenditure committees — which may raise without limits but cannot coordinate with candidates — raised $2.27 million between them, more than either candidate’s committee.
Bruce Harrell for Seattle’s Future raised $1,831,271 from 302 contributors and spent $1,232,835 against Wilson — a sum larger than Wilson’s entire campaign — plus $233,988 promoting Harrell. Ninety-three percent of the anti-Wilson spending landed in October, after Wilson had won the August primary by nine and a half points.
Katie Wilson for an Affordable Seattle raised $442,731 from 230 contributors and spent $272,828 for Wilson and $117,195 against Harrell. Add the smaller committees and the outside-money imbalance was roughly 3.9 to 1 against Wilson. She won anyway. How Washington’s coordination rules police the wall between this money and the campaigns — and who serves both sides of it statewide — is the subject of Independent expenditures and coordination in Washington.
| Contributor | Amount |
|---|---|
| Affordable Housing Council (Bellevue) | $110,000 |
| NAIOP Washington State PAC (commercial real estate) | $100,700 |
| Christopher Larson (Shoreline) | $57,500 |
| WA Association of Realtors PAC | $51,667 |
| Theresa Gillespie (Medina) | $50,000 |
| John Stanton (Medina) | $50,000 |
| MaryAnne Tagney (Seattle) | $50,000 |
| Saltchuk Resources, Inc. | $50,000 |
| Michael Hughes (Seattle) | $30,104 |
| Clise Properties Inc. | $30,000 |
| Thomas Ellison (Bellevue) | $26,042 |
| Judith Runstad (Seattle) | $25,209 |
| BH Pine St LLC · Hunters Capital LLC · HomeStreet Bank · AGC Build PAC · WA Multi-Family Housing PAC · Raymond Connell — $25,000 each | $150,000 |
| Grousemont Associates · Matt Griffin · Matt Oppenheimer · Samantha Holloway · Susan Brotman — $20,000–$20,834 each | $102,085 |
| Washington Teamsters Legislative League | $15,000 |
| Contributor | Amount |
|---|---|
| Protec17 PAC (professional & technical employees) | $75,000 |
| UFCW Active Ballot Club (grocery workers) | $75,000 |
| Progressive People Power (P3 PAC) | $18,653 |
| Pierre-Loup Griffais (Mercer Island) | $17,500 |
| Ashok Chandwaney (Seattle) | $15,000 |
| Carrie Barnes (Seattle) | $13,126 |
| William Pitcock (Seattle) | $10,417 |
| UAW Region 6 Western States PAC | $10,000 |
Labor split down the middle
Organized labor did not move as a bloc. The service and white-collar unions — Protec17, UFCW, UAW, SEIU 1199NW, OPEIU Local 8, AFT Washington — funded Wilson’s side. The Teamsters Legislative League, SEIU 775, the Washington Education Association, the Machinists, the Laborers and three Teamsters locals backed Harrell, most at the $650 direct cap.
The timing tells the same story as the amounts: Wilson’s labor money arrived in the fall, through the independent committee. Her spring launch had no institutional money at all.
The network that was already there
Wilson had never held office, and her organization — the Transit Riders Union, a small 501(c)(4) with revenue near $200,000 a year — never registered a lobbyist and holds no state contracts. On paper, she had no donor network.
The disclosure records say otherwise. Her first sixty days of fundraising — March 5 to May 4 — brought 770 donors giving $84,746: 94% Seattle residents, 767 of them individuals, no PACs, no unions, almost no one at the cap. We traced every one of those early donors through five years of Washington contribution records. 52 had given to the House Our Neighbors social-housing campaigns. 65 had funded Saunatina Sanchez’s 2024 council run. 26 were Seattle DSA contributors. The launch money came from the movement she had organized alongside for a decade — one that the Transit Riders Union’s own small contributions, to Seattle’s progressive council slates from 2013 onward and to the 2022 Raise the Wage Tukwila campaign, map precisely.
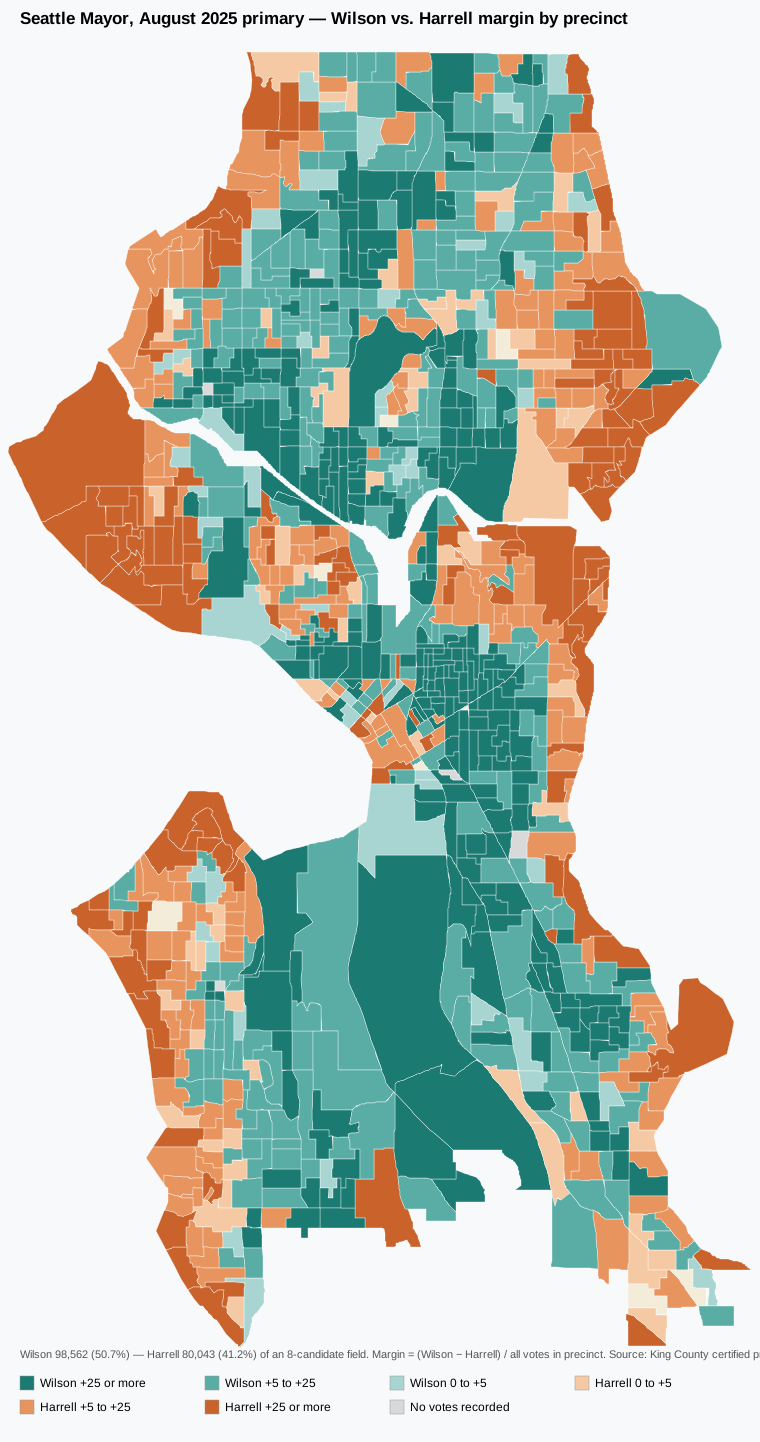
That network is measurable in the electorate too, and it predates her candidacy.


| District | Feb: Prop 1A | Aug: Wilson | Nov: Wilson |
|---|---|---|---|
| LD 32 — Broadview / Bitter Lake | 57.5% | 43.4% | 43.9% |
| LD 34 — West Seattle | 59.3% | 46.2% | 45.9% |
| LD 36 — Ballard / Magnolia / Queen Anne | 60.5% | 48.7% | 47.6% |
| LD 37 — Central District / Rainier Valley | 70.4% | 56.4% | 56.6% |
| LD 43 — Capitol Hill / U-District / Fremont | 65.4% | 54.5% | 54.9% |
| LD 46 — Northeast Seattle | 61.3% | 49.0% | 48.3% |
What this is not
Nothing in these records suggests wrongdoing by either campaign. Independent expenditures are lawful and disclosed; both committees filed what the law requires; the voucher program operated as designed.
The story the records tell is structural. Seattle built a public-financing channel, and in 2025 a candidate with a movement behind her and almost no conventional donor base used it to outlast $1.5 million in opposition spending. Whether that is the system working or the system being outflanked is a judgment this page does not make.
We name organizations, and individuals only where they gave at institutional scale to an independent-expenditure committee or reached the legal contribution cap. Small-donor and voucher-participant identities, though public in the raw records, are reported here only in aggregate.
Method, sources and limitations
Sources. Washington PDC contribution, expenditure and independent-expenditure datasets (kv7h-kjye, tijg-9zyp, 67cp-h962 on data.wa.gov), full 2025 cycle, retrieved 31 July 2026; PDC Campaign Finance Summary (3h9x-7bvm) for official totals; Seattle Ethics and Elections Commission Democracy Voucher Program end-of-cycle data file, 10 December 2025; King County Elections certified precinct results for the February special (kzmm-gq2e), August primary (tsx2-ia8a) and November general (rkie-6y8x) on data.kingcounty.gov; King County GIS voting-district boundaries; IRS filings via ProPublica Nonprofit Explorer for Transit Riders (EIN 452751950).
Reconciliation. Transaction-level sums match the PDC’s official committee summaries to the dollar. Precinct sums match certified citywide results exactly in all three elections. City voucher totals reconcile with PDC-reported contribution batches to within 2.4% (Wilson) and 0.8% (Harrell); the remainder is unitemized small cash reported in the same batches.
Limitations.
- Donor identities are matched on name, city and state as disclosed. The zero-overlap finding between the two candidates’ donor pools could conceal a handful of donors listed differently in different filings.
- Voucher shares treat the PDC’s aggregate “small contributions” batches as voucher-dominated, which the city’s own totals confirm to within the margins above.
- Independent-expenditure amounts are per-candidate as reported; where a filing covered several candidates we used the reported per-candidate portion.
- Both campaigns accepted contributions at a $650 cap and spent past the program’s $450,000 base limit, which the program permits once a candidate faces qualifying opposition spending; we describe the observed caps, not the administrative release decisions, which are outside these datasets.
- Early-donor network matching covers Washington state-disclosed giving from 2022 through 2026; giving outside PDC jurisdiction (federal races, some city-only filings) is not included.
- The precinct maps join certified results to current King County precinct boundaries; 1,015 of 1,020 Seattle polygons matched, and the remainder render grey.
Reproducing it. Every figure derives from the published datasets listed above with no manual entry; the per-precinct tables, map-generation scripts and the campaign-ecosystem graph extraction are retained with the project’s investigation files.